Almost everything the conventional wisdom says about the trend in inequality appears to be wrong. This conventional wisdom—exemplified by the work of Thomas Piketty and his coauthors—says that inequality has exploded in recent decades, reaching levels not seen since the early twentieth century. Many researchers, including some published in The Independent Review and/or affiliated with the Independent Institute, have noted fundamental flaws in Piketty’s work. For example, Donald Boudreaux noted “Thomas Piketty’s Flawed Analyses of Public Debt and Executive Compensation,” while Juan Ramon Rallo found “Some Fundamental Problems with Thomas Piketty’s Capital in the Twenty-First Century,” and Casey Mulligan’s review of Piketty’s Capital in the Twenty-First Century warned that the book’s readers “are strictly prohibited from seeing important facts from our world that might be incongruent with [Piketty’s] redistributionist regimen.” Likewise, Phillip Magness (the David J. Theroux Chair in Political Economy at the Independent Institute) and his coauthors have published a series of articles correcting the flaws of this conventional wisdom, including “How Pronounced Is the U-curve? Revisiting Income Inequality in the United States, 1917–1960.”
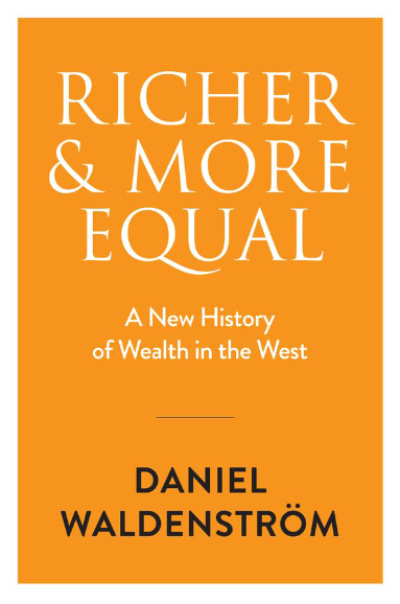
It seems that the dam has now burst with the publication of two major studies in 2024. The first, Gerald Auten and David Splinter’s “Income Inequality in the United States: Using Tax Data to Measure Long-Term Trends,” has received much-deserved attention. Auten and Splinter, using more complete measurements of income and transfers than previous studies, find that the share of after-tax-and-transfer income going to the top one percent barely changed between 1960 and 2019. The second is this book by Daniel Waldenström of the Research Institute of Industrial Economics in Stockholm, which deserves equal notice. Carefully examining more accurate and complete data from six countries—France, Germany, Spain, Sweden, the United Kingdom, and the United States—Waldenström finds that since the late 1800s, the West has grown richer and more equal.
Everyone already knew that the West has grown wealthier, but Waldenström’s statistics “are striking: today, we are more than three times richer in purchasing power than we were in 1980, and we are nearly a staggering tenfold richer than a century ago” (p. 1). Most of this increase in wealth has come from savings, rather than capital gains. By Waldenström’s calculations, for example, wealth grew at 3.4 percent per year in the United States from 1890 to 2010. 2.9 percent of this was from savings, while 0.5 percent was from capital gains. But these are averages. Wasn’t much of this simply the rich getting richer and the non-rich lagging behind? Not even close. Waldenström estimates that the wealth of the non-rich (the bottom 90 percent) increased much more rapidly than the rich (the top one percent) during the “Great Wealth Equalization” of 1910 to 1980 and hasn’t appreciably widened out since then. More precisely, across these six countries the growth rate of wealth per adult was 2.2 percent per year among the non-wealthy from 1910 to 1950 versus only 0.2 percent among the wealthy. From 1950 to 1980, the growth rate of wealth was 3.9 percent per annum among the non-wealthy, again outstripping the growth rate of 2.3 percent among the wealthy. From 1980 to 2010, the non-wealthy’s wealth growth rate slowed down a little—to 3.1 percent per year—while the wealth of the top one percent grew the fastest ever at 4.3 percent, but this gap didn’t increase inequality much and probably overstates things (more on this below). He concludes that the “post-1980 era witnessed the most rapid and extensive increases in wealth in the past century, and likely through-out modern history” (p. 128). As wealth didn’t grow much before the modern period, he could have said “likely through-out all of history.” Putting these trends together, on average the share of wealth held by the top one percent fell from a bit under 60 percent in 1890 to about 25 percent in 2010. Figure 6.4 of Richer and More Equal summarizes things this way: from 1910 to 2010, the wealth of the “elite” (the top 1 percent) grew 3-fold in France, 8-fold in Sweden, 16-fold in the U.S. and didn’t grow appreciably in the UK. Meanwhile, the wealth of the “people” (the lower 90 percentile) grew 24-fold in France, 54-fold in Sweden, 26-fold in the U.S. and 80-fold in the UK (p. 132).
These massive wealth increases were accompanied by a substantial shift in the composition of wealth that helps explain much of the broader trend. Waldenström finds that in 1890 housing and funded pensions comprised about 25 percent of wealth—with the bulk of wealth in the form of agricultural and business assets. By 2010, the proportions had almost exactly reversed. Housing wealth reached about half of all wealth, with funded pensions growing from a few percent to over 20 percent, and other assets (agricultural and business) falling to a bit over a quarter. This helps explain the Great Wealth Equalization. The poorer and middle classes vastly expanded their wealth through homeownership and pensions, gaining on the rich. One subsection of Richer and More Equal is titled “Western Wealth is Equalized through Lifting the Bottom, Not Lowering the Top” (p. 126). Waldenström is especially sanguine about the wealth-building potential of home ownership. He argues that home ownership gives one collateral that can be used to borrow against and smooth consumption in the face of adverse income shocks, that it promotes geographic mobility, and that it interacts with portfolio choice, as older households are able to increase their risky share of assets and capture their high average returns when they have amassed housing wealth. All in all, however, he estimates that the rate of return is very similar on housing and equity, while housing returns have much lower variance.
Waldenström uses the conventional definition of wealth—the value of financial assets minus liabilities, but this definition can hide a large fraction of the wealth of poorer groups. For example, it leaves out the value of non-financial assets such as automobiles, consumer durables, electronic gear, clothing, and the like. These are a small fraction of overall wealth (about 5 percent), but a large fraction of the wealth of the poor. Waldenström implies that these assets don’t have much market value. For example, he cites the common estimate that a car loses one-third of its value in its first year. Kelley Blue Book puts that figure at 20 percent, not one-third, but it’s not clear why the market value is the operative measure of wealth here. Perhaps I cannot sell my vehicle for as much as I bought it or as much as I must pay to replace it, but it is still of considerable worth, as I receive a flow of services from it and generally won’t sell it for its blue book value. It is more valuable than this to me, which is why most people hold onto their vehicles most of the time. If non-financial wealth were included measures of inequality would be lower.
While Waldenström’s numbers show there has been little increase in inequality since 1980 across these six countries, there is one of them in which his headline measure of wealth did become noticeably less equal during this period—the United States. However, a closer examination indicates that things haven’t necessarily become less equal in the U.S. The most valuable asset that many poorer Americans have isn’t their home or their funded pension—it is an unfunded pension, Social Security. Waldenström includes a valuable set of calculations that incorporate the present value of these public pensions. While unfunded pensions don’t increase national wealth, the issue in this debate isn’t about aggregate national wealth, it is wealth inequality and these public pensions have proven to be as sure a form of wealth as a home or bank account for those entitled to receive them. (Waldenström doesn’t put it this way, but he probably should.) Once public pension wealth is included, the share of wealth held by the top one percent in the United States no longer shows a significant upward trend in recent decades. It is within a few percentage points of the current level through the period from the end of World War II to the present. The top one percent’s share of financial-wealth-plus-public-pension-wealth in the U.S. was in the 40 to 50 percent range before 1940 but has fallen to the 20 to 25 percent range since the middle of the twentieth century.
Waldenström covers a lot of additional ground in Richer and More Equal. He shows that other measures of inequality between the top tier and everyone else have tightened up too—including inequality in literacy, the number of surviving children, stature, and life expectancy. He searches for the root causes of the drop in wealth inequality—arguing that much of it had to do with rising levels of education and developments in the financial sector that allowed the non-wealthy to get home mortgages and tap into corporate equity markets through pensions. Bankers are heroes not villains! He examines the impact of wars on wealth inequality, probes the magnitude and impact of hidden “offshore” wealth, and investigates the impact of inheritance on inequality. Interestingly he finds that the share of billionaires who inherited their wealth fell from about 60 percent in the early 1980s to 35 percent in the 2010s.
John Kennedy famously linked economic growth and inequality with the analogy that “a rising tide lifts all boats.” Waldenström concludes that “the findings in this book ... largely support Kennedy’s statement” (p. 201). The ultimate lesson is that “wealth accumulation is a positive, welfare-enhancing force in free market economies” (p. 4).
| Other Independent Review articles by Robert M. Whaples | ||
| Spring 2025 | Millennials, Gen Zs, Capitalism, Socialism, and Confusion | |
| Spring 2025 | Not Stolen: The Truth about European Colonialism in the New World | |
| Spring 2025 | Green Breakdown: The Coming Renewable Energy Failure | |
| [View All (106)] | ||

